How to Blend AI Research with UX Design
Not long ago, I had an epiphany—what a brilliant mystery of the brain, epiphanies are.
After wrapping up a prototyping session, my motors of spatial thinking kicked into a slow rumble and it hit me:
Why not model a thought hierarchy of the user with cumulative research and testing data?
That’s a pretty ambiguous thought out of context, so let me explain: one of the most important ways to challenge yourself as a UX Designer is to find new ways to observe your user. This stems from the indelible quality you must have as a UX Designer—empathy. I’m deeply interested in AI and, through my studies, have found some parallels between AI and my work as a UX Designer.
First of all, there’s always more to your users than you perceive, so it’s crucial to find new ways to learn about what goes on in their head. The holy grail of AI research is replicating how the human mind works—but, in order to do that, researchers must break components of the mind down to such a fundamental level that it can be replicated programmatically. Then, when we start to understand how to model a component of the brain, we can begin to predict how that component impacts human behavior. Neuroscience may be the lead player here, but AI research plays a massive role in discovering how we think at a deeper level.
How could AI influence design?
Currently, we have a pretty standard process when designing for people. We conduct user research, create user personas, prototype ideas and relentlessly iterate to refine the ideas. When executed correctly, this process generates great results. However, it doesn’t always give you the full picture—even after an exhaustive amount of iterations or enhancements.
Among all the research being conducted in AI, one of the most recognizable figures in the space is Ray Kurzweil. His theory on the Neocortex—among the vast range of other things he’s done—is used as a foundation for how Google tackles AI’s ability to understand and communicate in natural language. His theory suggests that the human brain is made up of 300 million modules, each of which can learn, recognize and implement a pattern. Furthermore, all of these modules are organized into a hierarchy created by our own thinking. It’s organized in such a way that the things we think and care about the most sit at the top of the hierarchy and descends down from there.
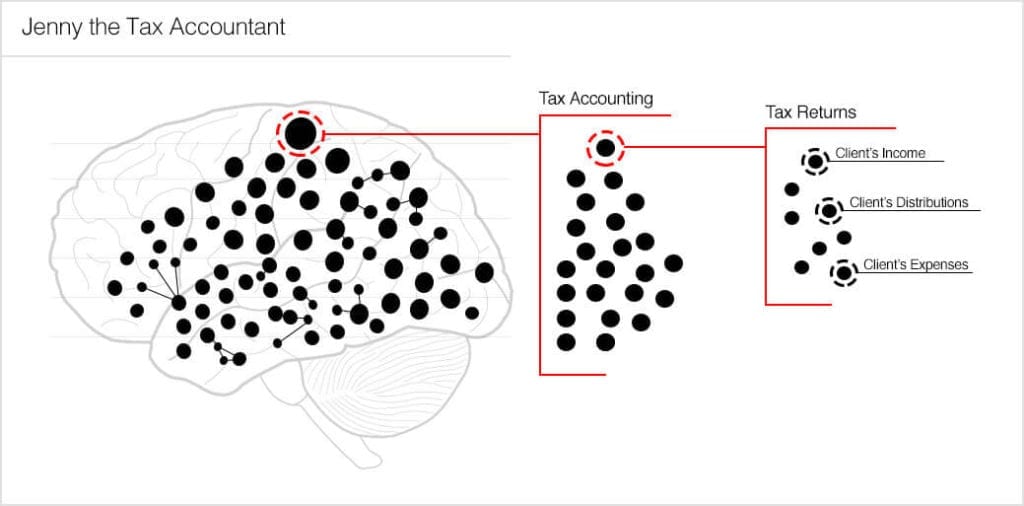
For visual context, look at the basic hierarchy model in the image above. Visualize each dot as a data point that makes up a user’s thought hierarchy: this hierarchy indicates that Jenny is a tax accountant, with accounting sitting at the top of her thoughts. Accounting is what she does professionally, so it’s what she thinks about for 40–60 hours a week. Therefore, it sits at the top.
But within that data point, or “symbol,” of tax accounting is an even deeper series of nested thought hierarchies. Looking from left to right in the model, you can see that things can become nested at a pretty deep level. Additionally, the model doesn’t even factor in the patterns that develop between these symbols, which ultimately form the complexity of our memories—or what we all know as knowledge.
What are the benefits of this?
What if you could see a hierarchy of things that matter the most to your users? A prioritized list? This would help tremendously to support design decisions.
You may be thinking, “I already do that in my processes.” But I’m not talking about what we learn from individual exercises—I’m talking about a hierarchy that’s the product of data aggregation from ALL of your processes and tools.
That’s great, but how do we do that?
We aggregate feedback and results from our processes and tools not only throughout the design process but beyond it, too. It needs to be an ongoing and living process. Here’s a brief list of some resources I use to help generate this data:
- User Interviews
- Card Sorting
- Whiteboarding
- User Personas
- Google Analytics
- Inspectlet
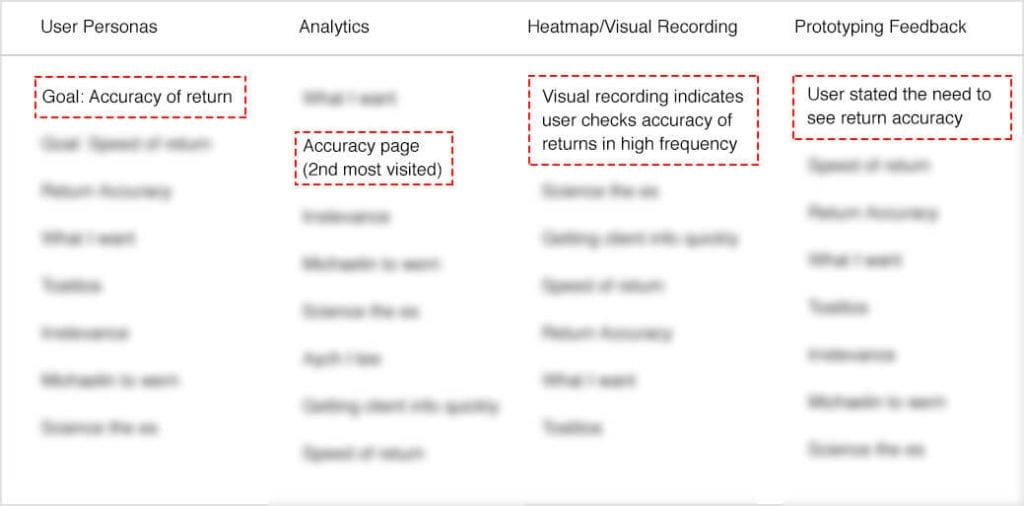
What we do is analyze the aggregate output of these processes and tools from all of our users, then search for consistencies. Then, we use those consistencies to build a hierarchy of subjects that are important to the user. In its entirety, you end up aggregating a lot of user data, like insights on what people say they want or need, their personal goals, and what they click on or interact with at an over-arching level.
What’s important to realize is that most UX Designers already use these tools and processes as a way to develop or refine their designs. However, there tends to be a disconnect between what you see in each of these processes individually and what the data says in culmination. You have the same data coming from different areas and in a different format.
Google analytics may be telling you that someone is visiting a page more frequently. Your heatmaps may light up a user’s interactions that lead to the same page. During prototyping, the user may have realized the need for that same thing in retrospect to a flow—but the user may not have indicated a need for it during initial user interviews. They’re all different pieces of data, but the need becomes more apparent when summarized. Individually, they might be considered an anomaly or less of a priority.
How do I aggregate this data?
Simply put, a spreadsheet. There’s no need to complicate it with a convoluted process. This is also an easier transition for many UX Designers because spreadsheets are commonly used to capture User Persona data. Personally, I have individual tabs for User Personas, Google Analytics, User Interviews, etc. and a master tab that weighs the consistencies and prevalence of specific subjects across all the tabs.
From there, I build a thought hierarchy and I constantly refine it as things, or needs, change. This hierarchy gives me direction on what I might be missing. You’d be surprised what the data says when you take a step back and look at it all from a holistic angle.
What else?
Before you go, remember that this process is really just the tip of the iceberg. As a UX designer, there are additional insights that you can garner from hierarchical thinking, like how memories are formed and how the identification of their sequential makeup can help you modify user behavior. But, at the very least, this should help you understand your users’ thought process on a much deeper, and sharper, level.
Want more expert insights and advice on the latest custom software development trends? Visit our blog to learn about everything from UX design and web development to machine learning and data science.