Data Analysis Made Easy: Extract, Transform and Load (ETL) Data with Power BI Desktop
Read in spanish
In most organizations, data goes through an ETL (extract, transform and load) process before it is available for reporting. During the ETL process, data is extracted from a data source, then transformed, validated, standardized, corrected, quality checked and ultimately loaded into a data repository—such as a data mart or data warehouse—where it is streamlined for analysis and reporting.
Typically, the ETL process is carried out by robust enterprise-grade ETL applications such as SQL Server Integration Services (SSIS) or other third-party tools. But in some organizations, business users do some of this ETL work right in Excel, often referred to as data shaping and transformation. The challenge with this method? The ETL process in Excel is usually a time-consuming, manual process that is not easy to automate.
However, Microsoft has a tool that can make this process much easier and faster: Power Query in Power BI Desktop.
What is Power Query? And How Does it Work with Power BI Desktop?
Power BI Desktop and Power Query give users the ability to automate the process of ingesting, transforming and loading data into internal tables in Power BI, which can then be used as a source for Power BI visualizations. Because Power Query maintains a step-by-step record of every action taken to ingest, transform and load data, you can repeat these same steps when you need to refresh the data. Once source data is refreshed, all Power BI visualizations are refreshed with the updated data as well.
Now, let’s take a look at Power Query in Power BI Desktop. To follow this example, you will need to download Power BI Desktop directly from Microsoft—don’t worry, it’s free—and install it. For the dataset, we will use the General Aviation 2013 Excel file available for public use from Data.gov. Download the excel file and save it to a local folder. Note: If using Office 2016 or later, you may need to open the file in Excel and save it as an Excel 2016 workbook.
The first step is to launch Power BI Desktop, then follow these steps:
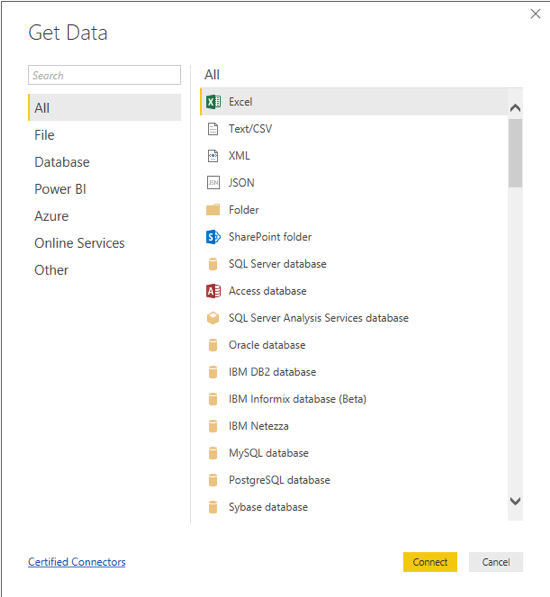
1 From the Power BI splash screen or toolbar, click on “Get Data,” select the Excel connector and click “Connect.”
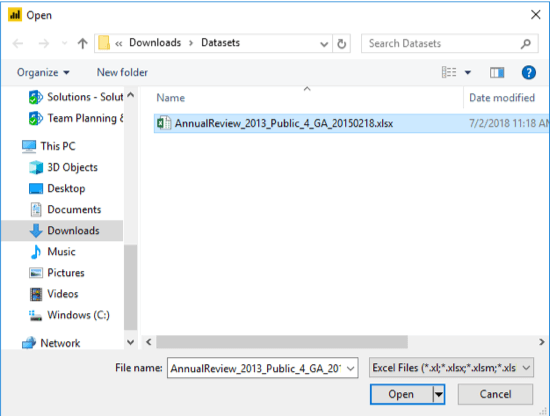
2 Browse for the Excel file, select it from the list and click “Open.”
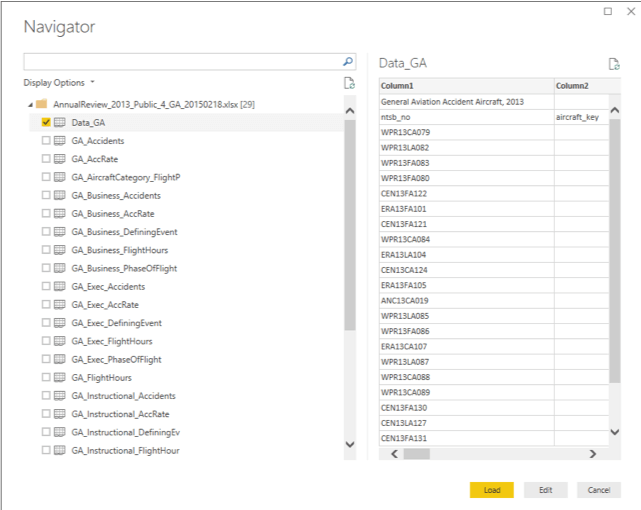
3 On the Navigator dialog, select “Data_GA” and click “Edit.”
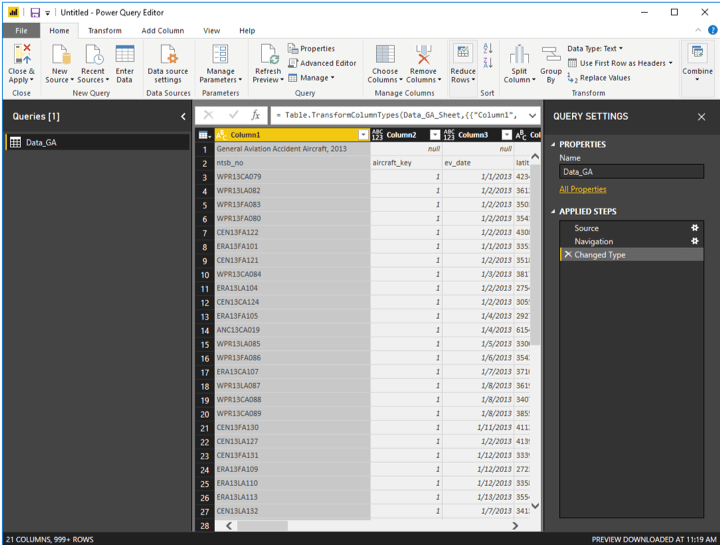
The Power Query Editor opens to shape and transform our data.
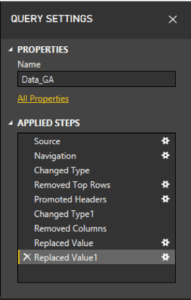
You can see that, on the right, the Query Settings pane lists all of the Applied Steps taken so far. These steps were applied automatically to indicate the path of the source file (Source), the columns that were automatically discovered (Navigation) and the data types automatically detected (Changed Type).
In cases where data is presented as a table with all of the appropriate headers and no empty rows, these steps will do the job for us accurately. In our case, the source excel file needs a little bit of clean-up—so we’ll shape and transform the data as described below:
Want to get started quickly with Power BI?
1. Set Appropriate Column Headers.
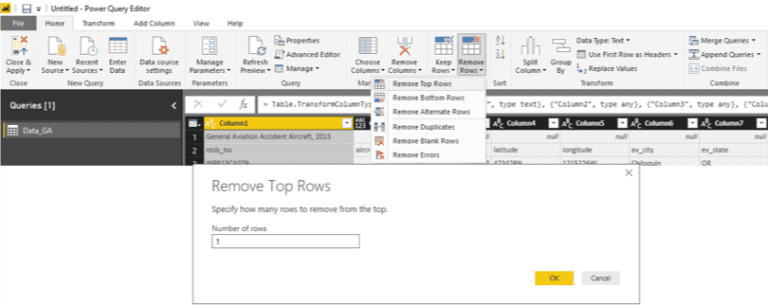
In this step, we’ll need to remove the first row because our column headers are actually in the second row. To remove the first row, click on “Remove Rows” from the Power Query Editor toolbar, click on “Remove Top Rows” and type “1” in the Number of rows dialog box.
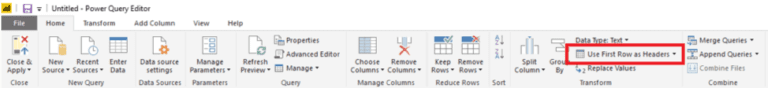
Now, we can indicate that the first row should be used as our column headers. To do this, click the “Use First Row as Headers” option on Power Query toolbar.
Our table now shows the correct column headers.
2. Remove Unnecessary Columns
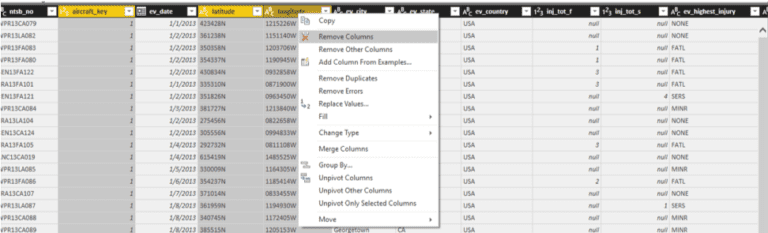
In this step, we need to remove all of the columns that we don’t need to analyze. To remove columns, select the columns while pressing the CTRL key, then right-click and select “Remove Columns.”
3. Replace Null Values
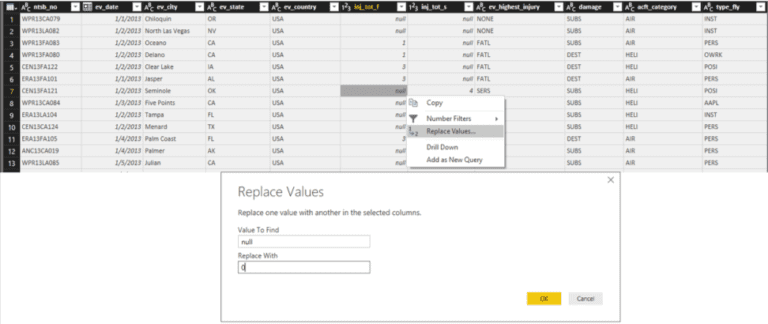
In this step, we need to replace null values with the number zero to ensure accurate analysis and to standardize values. In this example, we can replace all the null values for the “inj_tot_f” (Fatal Injuries) and “inj_tot_s” (Serious Injuries) columns. To do this, right-click on any row with a null value and select “Replace Values…” then type the number “0” in the Replace With dialog box and click “OK.”
Repeat for any remaining column with null values. All null values will be now replaced with 0.
Each of these data shaping and transformation steps have been recorded in the Applied Steps pane as seen below. So, whenever data in the data source changes, all you need to do is refresh your Power BI file to reflect the changes. Power Query will then apply the same steps we applied, which will refresh the data in the internal tables as well as all visualizations that reference them.
Want to learn more about Power BI and how you can implement it in your organization? With Power BI Ignite, our experts can show you how to accelerate Power BI implementation and adoption, deploy it safely, and maximize your investment.