Data Analysis Made Easy: Getting Started with Power BI
Read in Spanish
Power BI—Microsoft’s cutting-edge suite of business analytics tools—enables data professionals to ingest, transform and visualize data quickly and interactively. Designed with ease-of-use in mind, Power BI enables users with little or no report development experience to create beautiful reports and dashboards with just a few clicks—no programming knowledge required.
There are two main experiences to create Power BI reports and dashboards: Power BI Desktop and Power BI Service. Here’s how to get started:
Get started quickly with Power BI Ignite
Power BI Desktop
Power BI Desktop is a free—yes, free—report and dashboard development tool that can be downloaded directly from Microsoft.
Power BI Desktop arrives fully loaded with many interactive visualizations, including table, matrix, card, KPI, bar chart, column chart, pie chart, line chart, donut chart, funnel chart, scatter chart, area chart and waterfall chart visualizations. It also allows you to do geographic data analysis using maps powered by Bing and R script visuals using a built-in R script editor. You can even add interactive slicers and filters to slice and dice your data, import other visualizations from the marketplace and build your own custom visualizations.
One of the strongest selling points of Power BI is its ability to ingest data from various sources. Power BI arrives preloaded with many specialized connectors that import data from files and folders, databases, web services and other non-traditional sources. Some of these connectors include connectors to leading data platforms such as SAP, IBM, Oracle, Sybase, Hadoop and Teradata. Some of the specialized connectors include Salesforce, Google Analytics, Marketo, Facebook, Zendesk and many more.
In addition to the various sources that Power BI can ingest, a powerful transformation engine known as Power Query allows you shape, combine and transform the data to meet your needs to create stunning visualizations. The Power BI Query Editor allows you to provide repeatable, step-by-step instructions to transform and load the data every time data is refreshed. This approach allows you to apply a series of transformations to the source data, such as changing data types, creating calculated columns, filtering and replacing values, pivoting and unpivoting rows and columns, grouping and sorting data, etc. The user experience of the Power BI Query Editor is the same user experience offered by the Get & Transform Data in Excel 2016; both Power BI Query Editor and Get & Transform Data in Excel 2016 utilize the same Power Query M formula language.
Power BI Service
Power BI Service is a web-based cloud service that allows you to create, share and manage reports and dashboards. Like Power BI Desktop, anyone can register for free to get their own Power BI service from Microsoft. The Power BI Service offers a similar user experience as Power BI Desktop to develop reports and dashboards from a web-based interface. Users can switch between Edit mode and Read mode to modify reports or interact with the data. Users can also share reports with their colleagues by generating links that anyone can access from the web.
You can upgrade to a paid Power BI Pro user license to enable other features—such as email subscriptions and app workspace—and share and collaborate with other Power BI Pro users more securely. To understand the differences between Power BI free and Power BI Pro capabilities, check out this comparison chart from Microsoft.
In addition to Power BI Desktop and Power BI Service, Microsoft also offers the following special-license products and services to distribute Power BI reports:
Power BI Report Server
Power BI Report Server is an on-premise Power BI reporting solution that allows you to publish Power BI Desktop reports within your organization’s private network. This is a great option if you are not ready to move your reports to the cloud. Check out the Power BI Report Server guide to learn more about getting started.
Power BI Premium
Power BI Premium allows organizations to distribute dashboards and reports for internal and external users without the need to pay for individual user licenses. Check out the Power BI Premium guide to learn more about getting started.
Power BI Embedded
Power BI Embedded is a special type of licensing that enables Independent Software Vendors (ISVs) to integrate Power BI visualizations in their applications. Check out the Power BI Embedded e-book to learn more about getting started.
Power BI Mobile
Power BI Desktop allows you to create reports and dashboards for both desktop and phone layouts. All visualizations that you create using the desktop layout can be reutilized in the phone layout by simply dragging, dropping and resizing. The phone layout is optimized for phones when used in portrait mode.
Why Microsoft and Power BI?
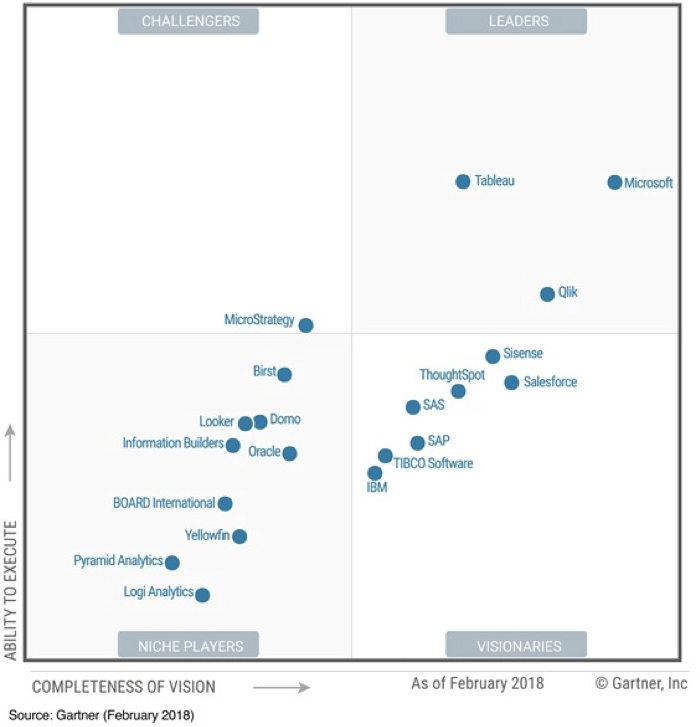
Microsoft has been recognized by Gartner as a leader and visionary in Analytics and BI Platforms for 11 consecutive years. As of February 2018, Microsoft is positioned furthest to the right for completeness of vision within the Leaders quadrant (see Figure 1). Much of this recognition is based on the success of Power BI, and the tools and services that Microsoft has to offer in the Azure cloud.
How can AgileThought help you with Power BI?
We have helped clients of all sizes implement Power BI as a strategic part of their data analytics and business intelligence efforts. From envisioning and planning to deployment and implementation, our solution architects can help you integrate Power BI in your Data Analytics journey.
Want to learn more? Check out our recorded webinar, “Data Analysis made easy with Power BI,” to learn how you can use Power BI to enhance your reporting capabilities.Get started quickly with Power BI IgniteFigure 1 Gartner Magic Quadrant (Feb 2018)