Self-Service Business Intelligence (SSBI)
Self-service business intelligence (SSBI)
Imagine an environment where the mountains of data that a company collects and aggregates is effectively wielded by data scientists and analysts, giving that company many competitive benefits. Insights are formed, trends are quickly identified, decisions are well-informed, and data is utilized proactively versus reactively. Up until recently, this was a pipe dream for these data workers. The tools to develop, collaborate, and control these uniquely analytic and creative endeavors fell short of the need for various reasons: inconsistent approaches, inefficient software development processes/management, and lack of a collaboration platform are examples.
Self-Service Business Intelligence (SSBI) was born of this need to quickly and effectively take a myriad of data sources that a company may utilize and make sense of the data. SSBI, in short, is a suite of tools given to data workers to enable fast, flexible, intuitive, visual, collaborative, and controlled data analysis. Data workers become the knowledge developers without a heavy dependence on a dedicated IT team.
In the world of Microsoft, there arguably existed a forerunner to SSBI: Excel. The ubiquitous spreadsheet application had always been synonymous with data work, and because it was file-based, collaboration was somewhat implied. However, Excel’s shortcomings in control, collaboration, and flexibility became very apparent as data scaled to the levels we see today. Data workers and consumers wanted a better Excel — one that preserved the original application’s ease of use and powerful analytic capabilities while augmenting its aggregation capabilities and visualizations.
Enter PowerPivot. If native Microsoft Excel is a car, PowerPivot is a jet engine that attaches to it without modification needed. It is Excel that all data workers know and love, but granted the analytic capabilities of enterprise-grade analysis databases. In plainer terms, it transforms data workers into knowledge developers. Ad-hoc, flat-file data that needs to be linked with more structured data and presented? No sweat. Disparate sources of data that need to be related and analyzed? Piece of cake. Combine Excel workbooks or PowerPivot workbooks to paint a complete picture? Go right ahead.
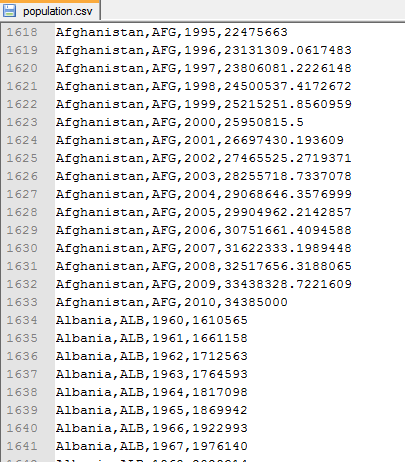
A CSV of Population Data
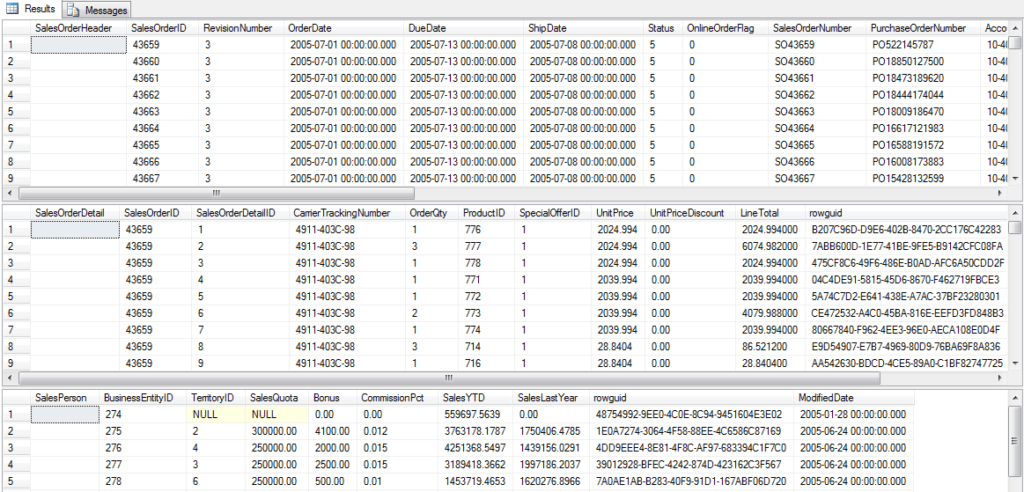
Sales Information for the Company
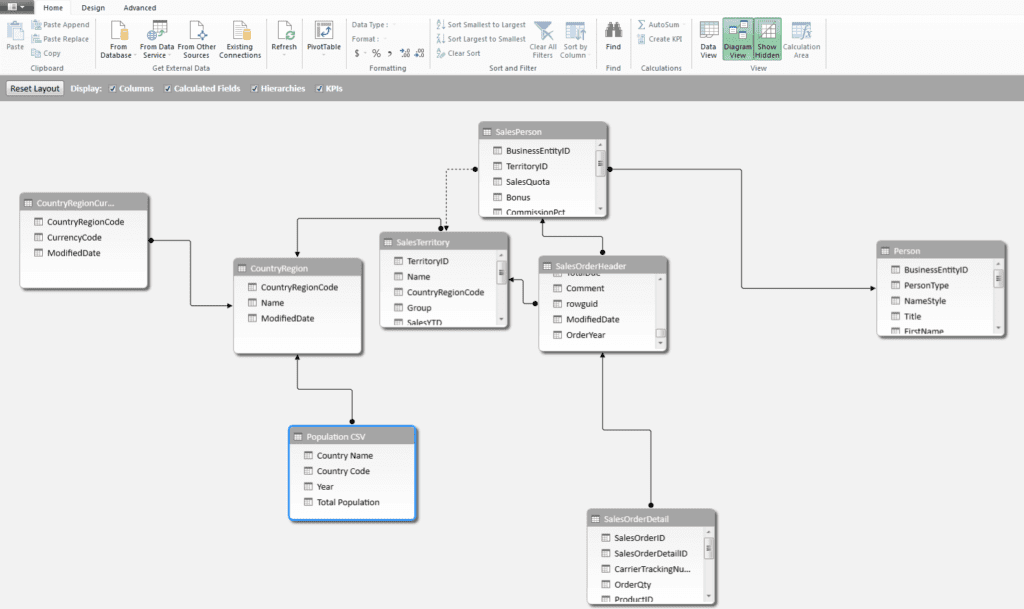
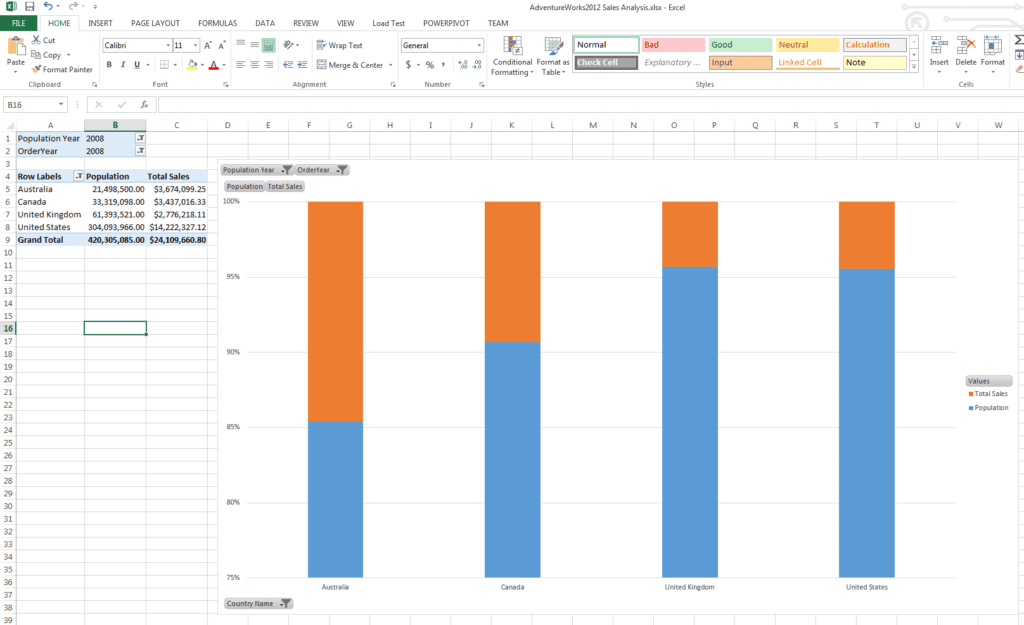
Sales Information for the Company Related to the Population CSV
A Quick PowerPivot Analysis of Sales as a Percentage of Population
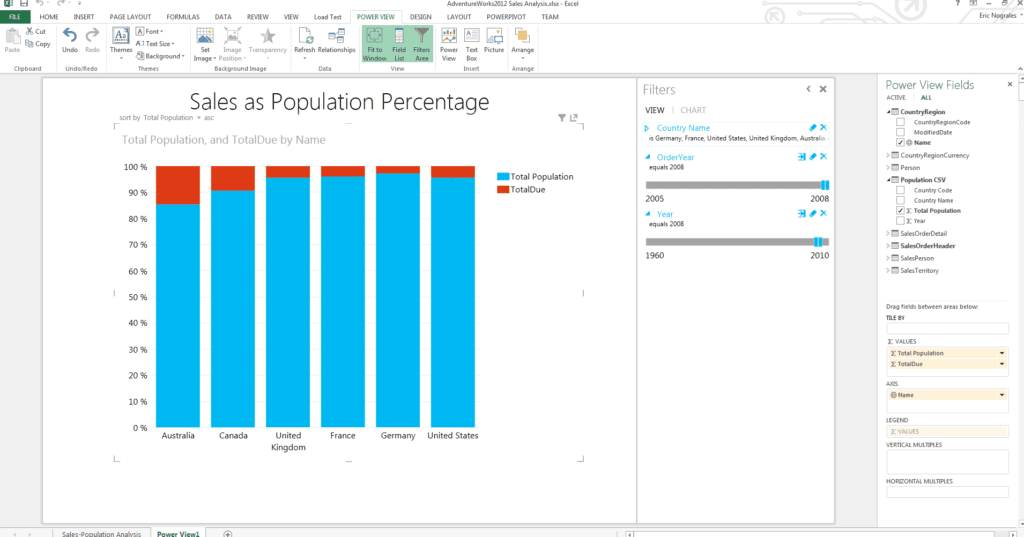
To put icing on the cake, a tool that leverages PowerPivot data to form professional, presentation-grade data was also released called PowerView. Both are now standard features of Excel 2013.
PowerView Formatted Analysis
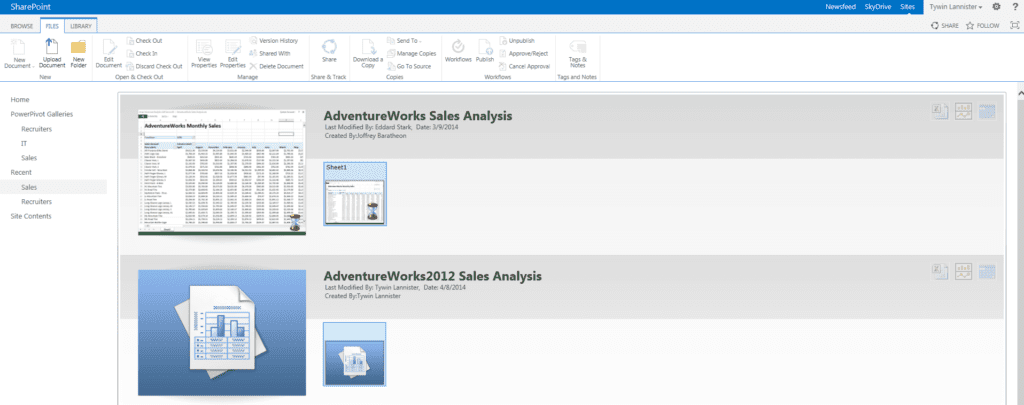
All these capabilities are, of course, tremendous for data workers, but what of collaboration? After all, discoveries in data often occur when data workers can collaborate with one another in a type of creative process. Luckily, a tool had existed for many years whose main purpose is collaborative document-based work: SharePoint.
SharePoint PowerPivot Gallery for Collaboration
With all of these tools available to drastically improve a company’s data worker capabilities, it is tempting to simply deploy a SharePoint farm, enable PowerPivot and PowerView on all desktops, and let SSBI grow organically! However, one need simply look back on the history of “Excel hell” on shared network drives to realize that a pragmatic, methodical approach must be taken to ensure that these tools do not become a double-edged sword. A “ready, fire, aim” approach is never recommended for any software project, let alone one where the end-users are essentially the developers.
When formulating an Enterprise SSBI Strategy, there are key considerations that must be clearly defined to ensure the adoption and ongoing success of SSBI, as discussed by Kay Unkroth in TechEd North America 2013.
- Clear Roles and Responsibilities
- Who are the subject matter experts of each area? How will the Enterprise SSBI be governed? What working groups will be formed? What policies, procedures, and standards will be established?
- Control and Oversight
- What workflows need to be established to enforce the policies, procedures, and standards? What rules must be established for viewing data? How will approvals of PowerPivot workbooks function in each workgroup?
- Empowering Users with Tools and Training
- Who will be primarily producing the analytics? Who will be consuming the analytics? What tools will the producers and consumers of data use?
- Ensuring the Proper Data Infrastructure
- What permissions on databases will need to be set to support SSBI? Are there any file-based sources that will need to be used? How will SSBI support the overall Corporate BI strategy?
- Seamless and Secure Collaboration
- How will SharePoint be logically segmented by working group? Where can workgroups share information quickly? What SharePoint workflows need to be established?
While items #1 and #2 may seem to imply that Enterprise SSBI needs much overhead to control, there is a balance that an organization can strike: just enough process to ensure that SSBI does not grow out of control, but not so much that data workers do not feel stifled. After all, SSBI is both an analytic AND creative process. This balance can be achieved by borrowing some elements from tried and true Agile software development methodologies.
In the second part of this series, we will walk through an exercise in which an organization formulates a proper SSBI strategy, implements the strategy with Excel 2013/SharePoint 2013, and governs the strategy in a lean fashion borrowing elements from the Scrum methodology of agile software development.